Professional Experience Project
Developing an e-Resource Usage Dashboard for Texas Libraries
Kate Reagor, University of Texas at Austin - School of Information
Kate Reagor, University of Texas at Austin - School of Information
Data collection is extremely important to all government funded entities, and libraries are no exception. To justify their continued funding, library staff must collect and maintain data on material circulations, program attendance, computer use, and more. But these days libraries are increasingly expected to provide electronic content as well as physical: reference and journal databases, resources for career development, lanaguage learning, genealogy, early childhood literacy, and legal assistance. The use of these resources also needs to be reported, and yet the expertise required to collect and understand data showing how online resources are being used is often beyond the staff capabilities of smaller libraries - public and academic.
Though Texas libraries might license electronic resources on their own, the majority get their core collection through membership in the TexShare Databases Program, a program of the Texas State Library and Archives Commission. TexShare provides 600+ Texas libraries with access to 68 electronic resources from seven different providers. But gathering usage reports for every TexShare resource involves visiting a dozen different administrative platforms, many of which use different metrics and standards for reporting use. And while TexShare program staff do collect usage data for all libraries and resources in the program, the amount of time required to process and standardize the data to the point where it would be useful to an individual library has long been a barrier to providing this data directly to their members.
To assist TexShare staff in aiding Texas libraries who are unable to collect their own e-Resource usage data, I undertook the following tasks:
While I undertook my Professional Experience Project in partnership with the Texas State Library and Archives Commission, I am also employed by that agency and work with the TexShare programs. All tasks performed for this project were outside the scope of my normal work duties.
After my initial project proposal was approved, I worked with my field supervisor to develop a formal project charter. The charter details key aspects of the project, including:
Included with the charter was a detailed timeline showing all tasks and deliverables, task dependencies, and when I expected each to be completed. These tasks were broken out into two distinct phases: the Data Processing phase (database and workflow creation) and the Data Visualization phase (conducting a needs assessment survey and creating an online dashboard).
See the full project charter and timeline
As a state agency, staff at the Texas State Library and Archives Commission are often restricted in the software available to them. I also had to consider existing staff capabilities around coding and programming languages when choosing how to manage the data cleanup workflows. The workflows needed to be in a format that could conceivably be understood and adopted by current or incoming staff members. I communicated with my field supervisor and agency IT staff and selected the following applications:
Out of the dozen-plus vendor-supplied usage data reports currently collected by TexShare staff, six were selected for initial inclusion in this project. Because e-Resource usage reports are in the process of adopting a new reporting standard, COUNTER 5, priority for inclusion was given to the four reports already provided in COUNTER 5 format: Credo Reference, all EBSCO resources, three Gale Cengage resources (Gale In Context: Science, Gale in Context: Opposing Viewpoints, and Gale OneFile: Health and Medicine), and the ProQuest SciTech Collection. Two additional reports in non-standard formats were also included owing to their popularity with the project's target libraries: HeritageQuest Online, and LearningExpress Library.
Before the data from these reports could be processed, a full assessment had to be performed to determine what format each report came in, what transformations would be needed to ready the data for import into the database, and how non-COUNTER 5 data could be converted into an approximation of the COUNTER 5 metrics. This information was later formalized into a report describing all data included in the TexShare Usage Reporting Dashboard, and what transformations were made to standardize the reporting formats and metrics.
TexShare Usage Report Documentation
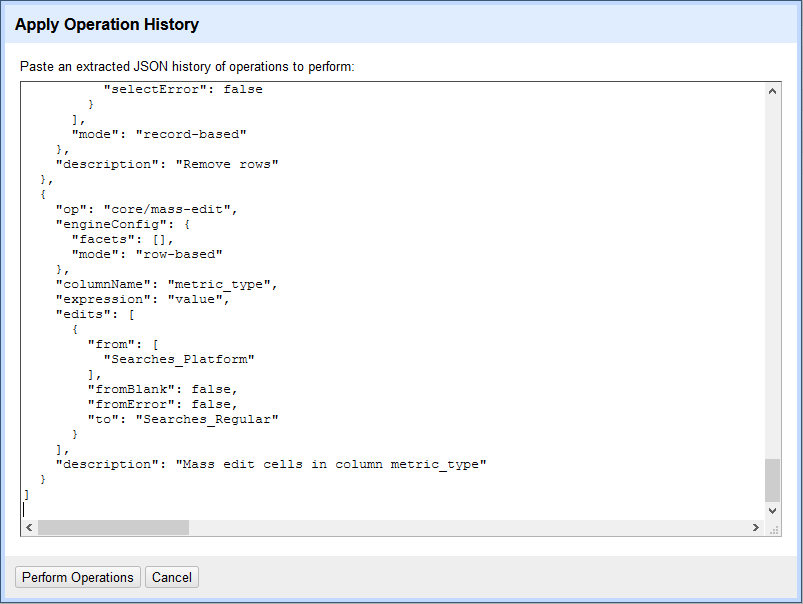
The data workflows for cleaning and standardizing the reports were created in OpenRefine. Using OpenRefine, I created a series of transformations for each vendor's monthly usage report that would normalize their layouts and ready them for import into the database. Once complete, these transformations could be saved as a JSON file, and then applied to all subsequent monthly reports from the same vendor.
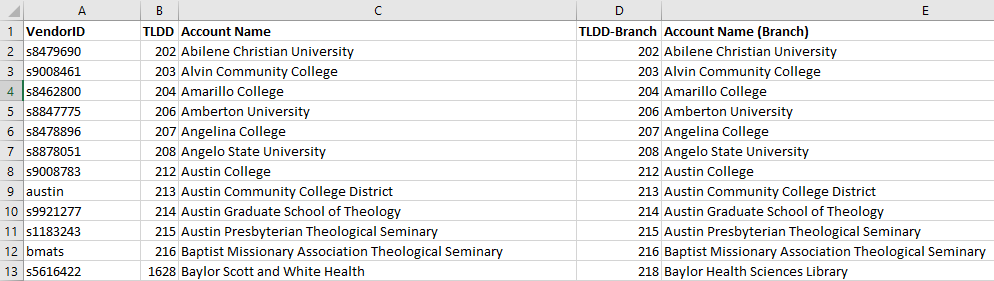
Next I needed to standardize the library names and identifiers, which can vary across reports. The TexShare Databases program already uses a set of unique ID numbers to identify each member library and their branch locations. Each e-resource vendor also uses their own unique IDs to designate individual accounts. Using these sets of IDs, I created lookup tables for each report, allowing me to match the TexShare ID number for each library to their own usage numbers within the report. Once imported into the relational database, these IDs would be used to join that data to the table containing the member libraries' names and information. Additionally, because libraries sometimes have multiple vendor accounts spread across their branch locations, I set up the lookup tables to identify branch accounts and make sure their usage numbers were included in the institution's total usage.
The data workflows could now connect to those lookup tables and automatically match the vendor IDs with the TexShare IDs. To make sure no institutions were missed, I created additional workflows for each report to check and identify any vendor IDs for which there was no match in the lookup tables. Any unmatched IDs could then be identified, and those institutions added to the lookup table.
Some usage reports were already standardized and required relatively little work to get them into the proper configuration. Others presented a larger challenge, including one report that arrives as four different spreadsheets, each with different data types and column headers. But I was ultimately able to develop a single workflow for each of the six reports, transforming files that looked like this:
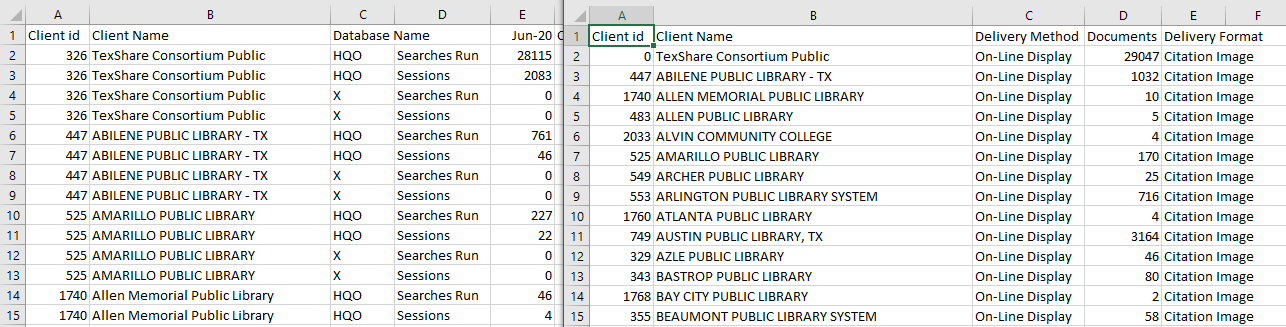
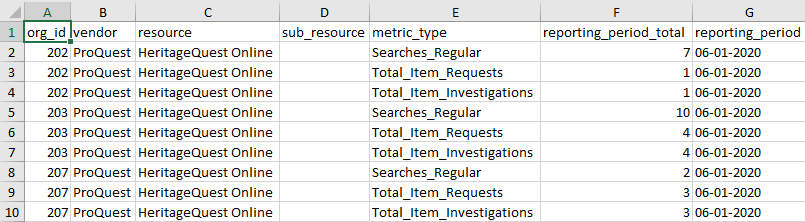
...into a format ready for import into the database.
After processing all available reports going back to September 2019 (the start of the current state fiscal year), I set the data workflows aside to work on other areas of the project. But when the new reports for June 2020 started to arrive in early July, I ran a test to see how long processing and importing a single month's worth of usage data using the new workflows would take.
I processed six usage reports across nine files, collectively containing upwards of 30,000 rows of data, ran ID checks on each report, updated two of the vendor ID lookup files with new library information, and uploaded the completed files into the database. Work that would previously have taken hours was completed within the span of 30 minutes.
Because the data workflows and ID lookup tables are handled externally in OpenRefine, the database design ended up being relatively simple. It is composed of two tables: one storing information on the TexShare member libraries, and one for the e-Resource usage data. The tables are joined using the TexShare program's unique organization IDs.
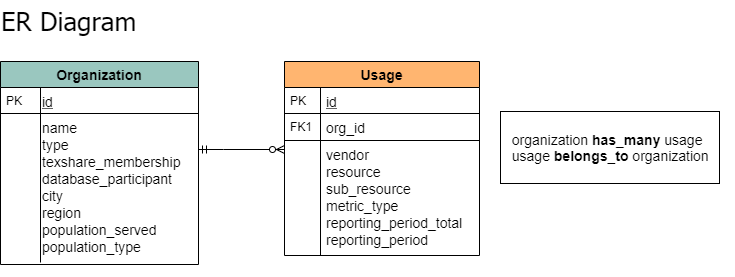
The agency's IT does not currently support use of MySQL database servers by non-technical staff, so the database was created using Microsoft Access. The library data was pulled from the program's customer management software and imported into the Organization table, and the cleaned and standardized usage data was imported into the Usage table. The data was now ready to be connected to a visualization application and made available to TexShare member libraries.
Before tackling the data visualization of library usage data, I wanted to gather feedback from Texas libraries about what they would want from such a display. To this end, I developed a survey asking libraries about their needs around usage data collection and display for their electronic resources: specifically, what their priorities would be if TexShare staff were to compile and supply usage data directly to libraries.
After an initial run by a smaller focus group of library staff, the survey launched on July 13, 2020 and stayed open through July 25. Staff from 396 libraries were invited to participate. Because collecting usage data is a particular challenge for libraries with limited staff and/or technical expertise, target libraries were limited to:
Surveyed libraries were further limited to those who showed some patron use in at least two of the four primary vendor reports included in the project during State Fiscal Year 2019.
Of the 396 library staff invited to participate, 154 completed the survey. I took the resulting survey data and created a report displaying the results in Tableau.
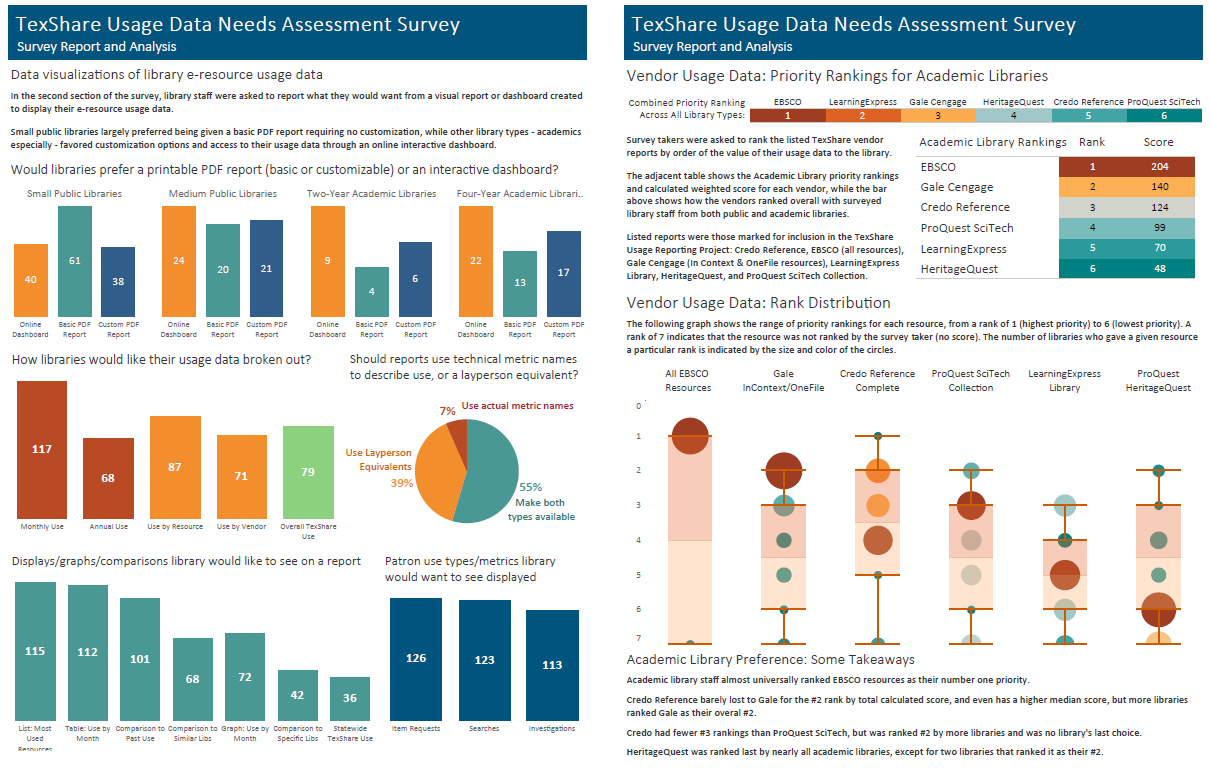
View the full TexShare Usage Data Needs Assessment Survey Report
While waiting for the survey data to come in, I began work on visualizing the e-resource usage data stored in the database. Working in Tableau, I started out focusing on creating a customizable report formatted as a printable PDF. However, as the incoming survey responses indicated a great deal more interest in being able to view and download usage data through an online dashboard, I switched my focus.
I designed the dashboard in Tableau Desktop and made it available online through Tableau Public. The main landing page allows any user to select their library and indicate the date range for which they would like to see their usage data displayed.
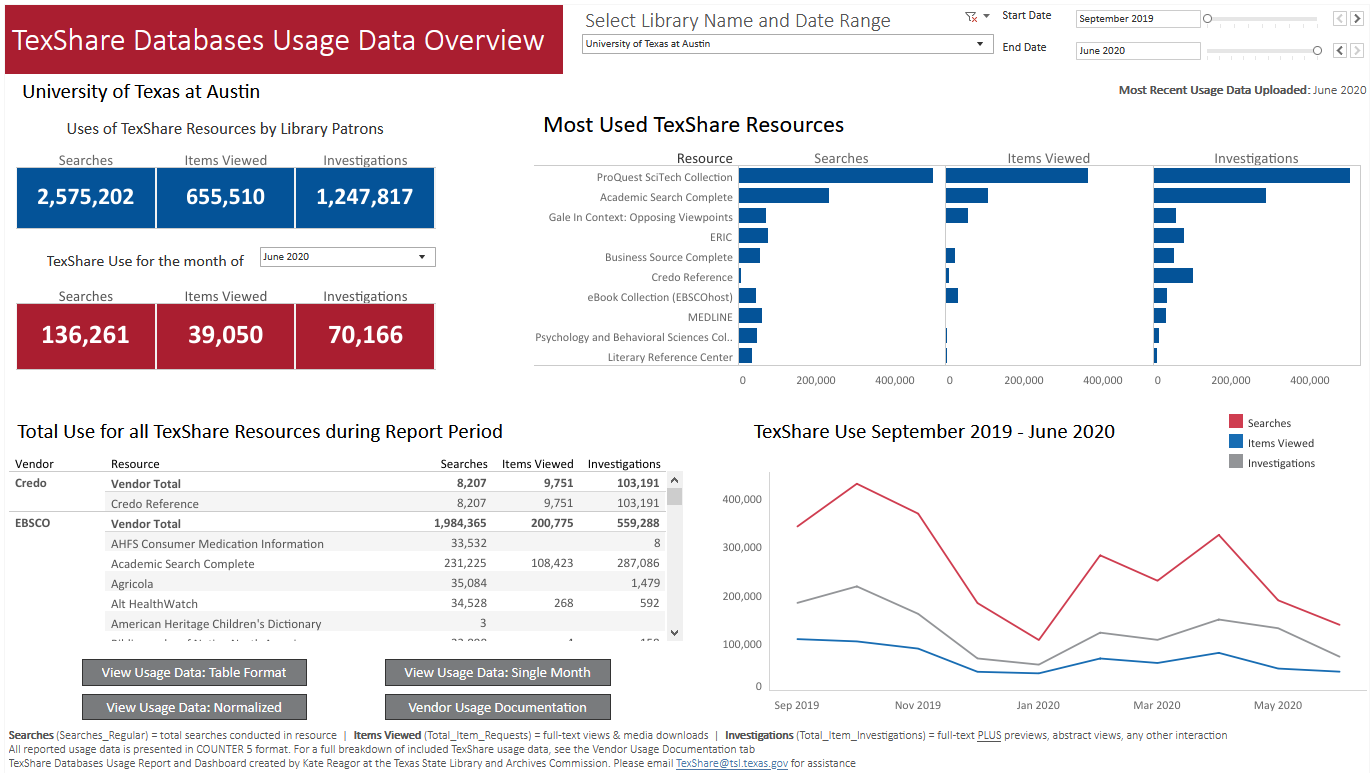
At a glance, the dashboard displays information on how the library's patrons have been using their e-resources. Navigation buttons at the bottom take them to different report views, where they can download their usage data in the format of their choice. The only planned element that didn't make it into the dashboard was the basic printable PDF Usage Report. I determined that a completed report would need to contain information from outside the scope of this project (such as program fee data and cost savings) and it would therefore need to wait for future development.
If the TexShare program chooses to officially adopt the Usage Dashboard as a method for providing usage data to its members, there will certainly be room for ongoing updates and development. My recommendations for project updates going forward include:
I do hope to see this usage project implemented and continued as part of the TexShare program's support to its members. If I had to present a single takeaway from the member feedback in the needs assessment survey, it would be that there is a genuine need from Texas libraries for greater assistance in both collecting and understanding their e-resource usage information. If the Texas State Library were able to find ways to take a more active role in helping libraries manage their data, it could prove invaluable to them.